United States Crude Oil Stocks Change 1982-2018 | Data | Chart | Calendar
Via : tradingeconomics
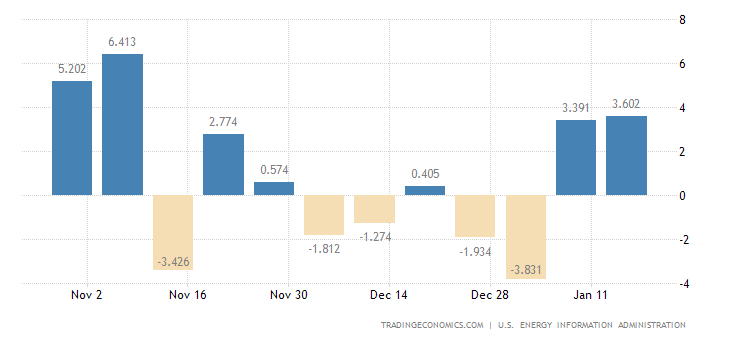
Stocks of crude oil in the United States jumped by 5.836 million barrels in the week ended July 13th 2018, following a 12.633 million drop in the previous week, which was the highest decline in crude inventories since the week ended September 2nd 2016. It compares with market expectations of a 3.622 million decrease. Meanwhile, stocks of gasoline went down by 3.165 million barrels while markets expected a 0.044 million drop. Crude Oil Stocks Change in the United States averaged 0.05 BBL/1Million from 1982 until 2018, reaching an all time high of 14.42 BBL/1Million in October of 2016 and a record low of -15.22 BBL/1Million in January of 1999.
No comments:
Post a Comment